UX|UI Design
Replace a third-party survey tool by a scalable in-house solution
Design a scalable solution that improves user satisfaction and simplifies data processing.
Overview
At a B2B SaaS company specializing in sustainability reporting, I led the design of two in-house-built surveys to replace a third-party solution. The goal was to create a scalable, user-friendly solution that improved user satisfaction and engagement and simplified data processing.
Role & Responsibility
Lead Product Designer
Problem
The third-party survey tool presented several limitations:
Users couldn’t provide diverse types of data input.
The company struggled to analyze submitted data effectively.
Developers found it challenging to work with the data or expand the tool’s features.
Timeline
6 weeks in total: Stage 1 (Pre-selection): 3 weeks and Stage 2 (Evaluation): 3 weeks


The in-house survey tool meets diverse user needs by delivering guidance, control, and scalability.
It's not just about collecting data—it's about creating a simple experience that drives engagement, efficiency and future growth.
Sustainability Managers: Need tools to gather input and track survey progress efficiently.
Contributors & Internal Experts: Require clear guidance and a simple interface to complete surveys quickly.
Developers: Need scalable architecture to analyze data effectively and support future growth.
A two-step survey is needed to gather the input from stakeholders.
Scope
The sustainability standard requires to separate steps of requesting input from stakeholders. That is why the project is split into two phases:
Phase 1 (Pre-selection): User pre-select the sustainability topic, they can provide input to.
Phase 2 (Evaluation): User give in-depth input on their risks and impacts of each sustainability topic. Every evaluation needs to be explained.
With limited time, a small team and focused testing, we delivered an effective solutions.
Constraints
Despite conducting only 6 user interviews and 10 usability tests due to time constraints, we gained valuable insights to guide the design.
Working with a small team of 2 developers, 1 product manager, and myself, we focused on delivering the most important workflows and addressing critical user needs.
Discovery
Identified Pain Points are limited flexibility, usability challenges and inefficient data processing
Conducted 6 user interviews to understand pain points and needs, and collaborated with developers to define technical constraints.
Identified three major pain points: limited input flexibility, poor usability, and inefficiencies in data processing.
Discovered users needed progress tracking to improve engagement.

Ideation
Rapidly sketched and validated low-fidelity concepts to align user needs within time constraints
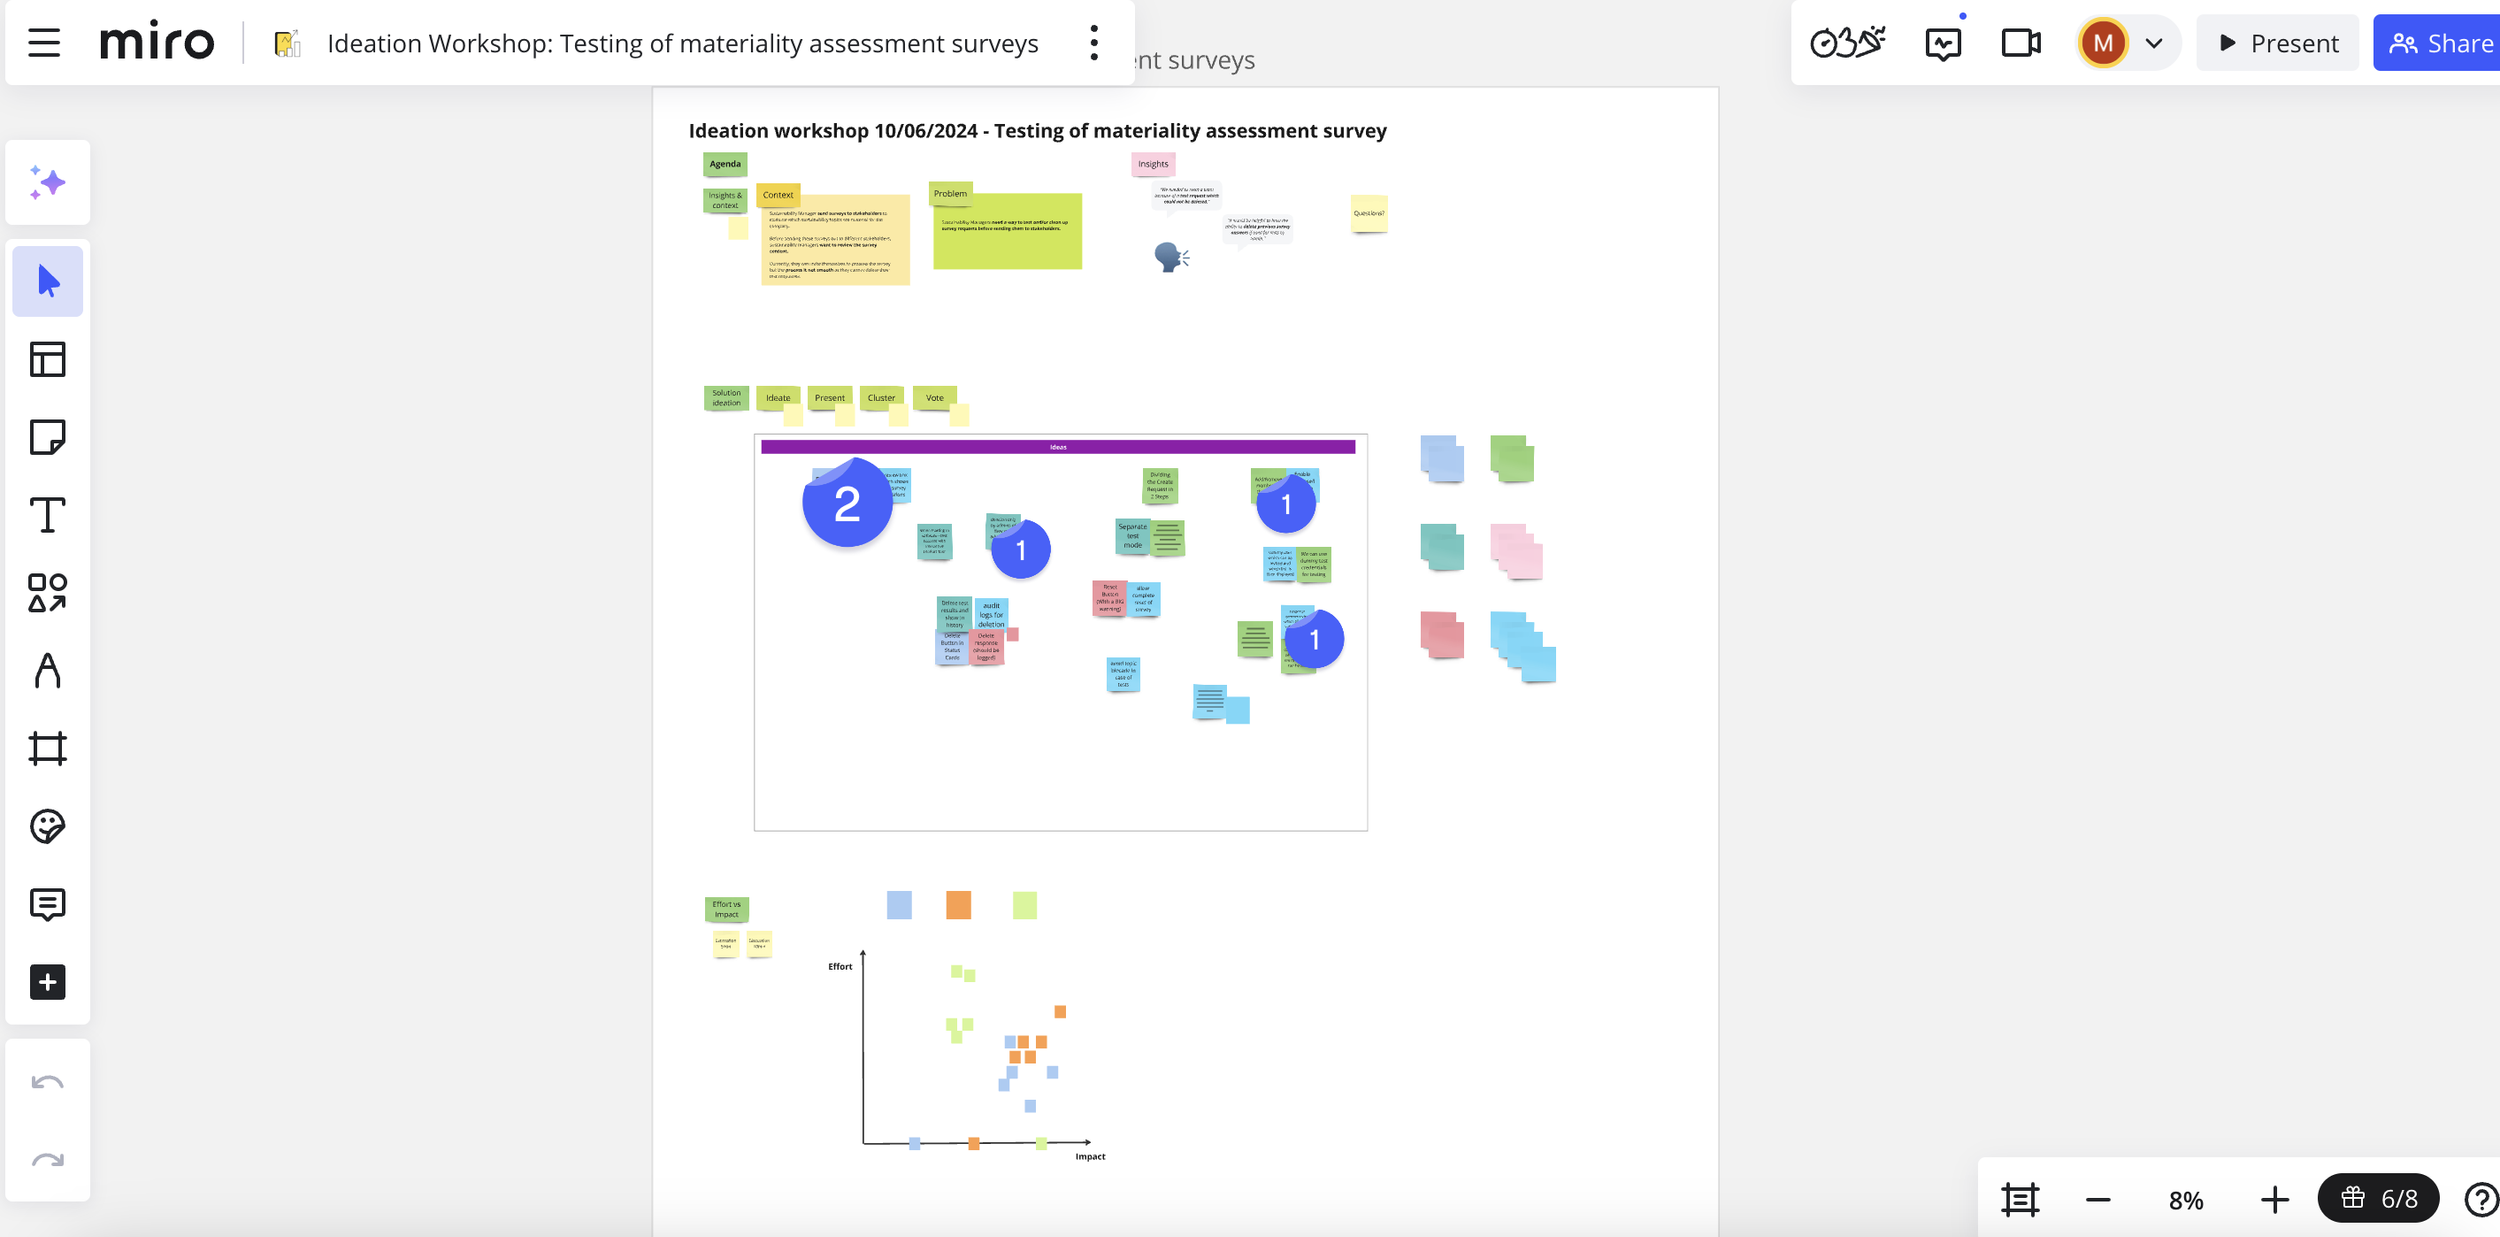
I prepared and conducted a Crazy 8-Workshop with the product and tech teams to brainstorm potential solutions. We voted for the best three ideas and evaluated them with the help of an Impact-Effort-Matrix.
We prioritized features like flexible input types, progress tracking, and educational guidance.
Based on the workshop insights, I sketched multiple low-fidelity concepts and validated them with developers to ensure feasibility.
Design
Limited testing time meant focusing on core user flows and iterating quickly
I created interactive prototypes and conducted 10 A/B Usability tests (5 per survey stage). Based on the user feedback, I went through two more iteration cycles with continued closed collaboration with the developers.
I learned that clear progress indicators and step-by-step guidance are key to simplifying usability and ensuring successful adoption.
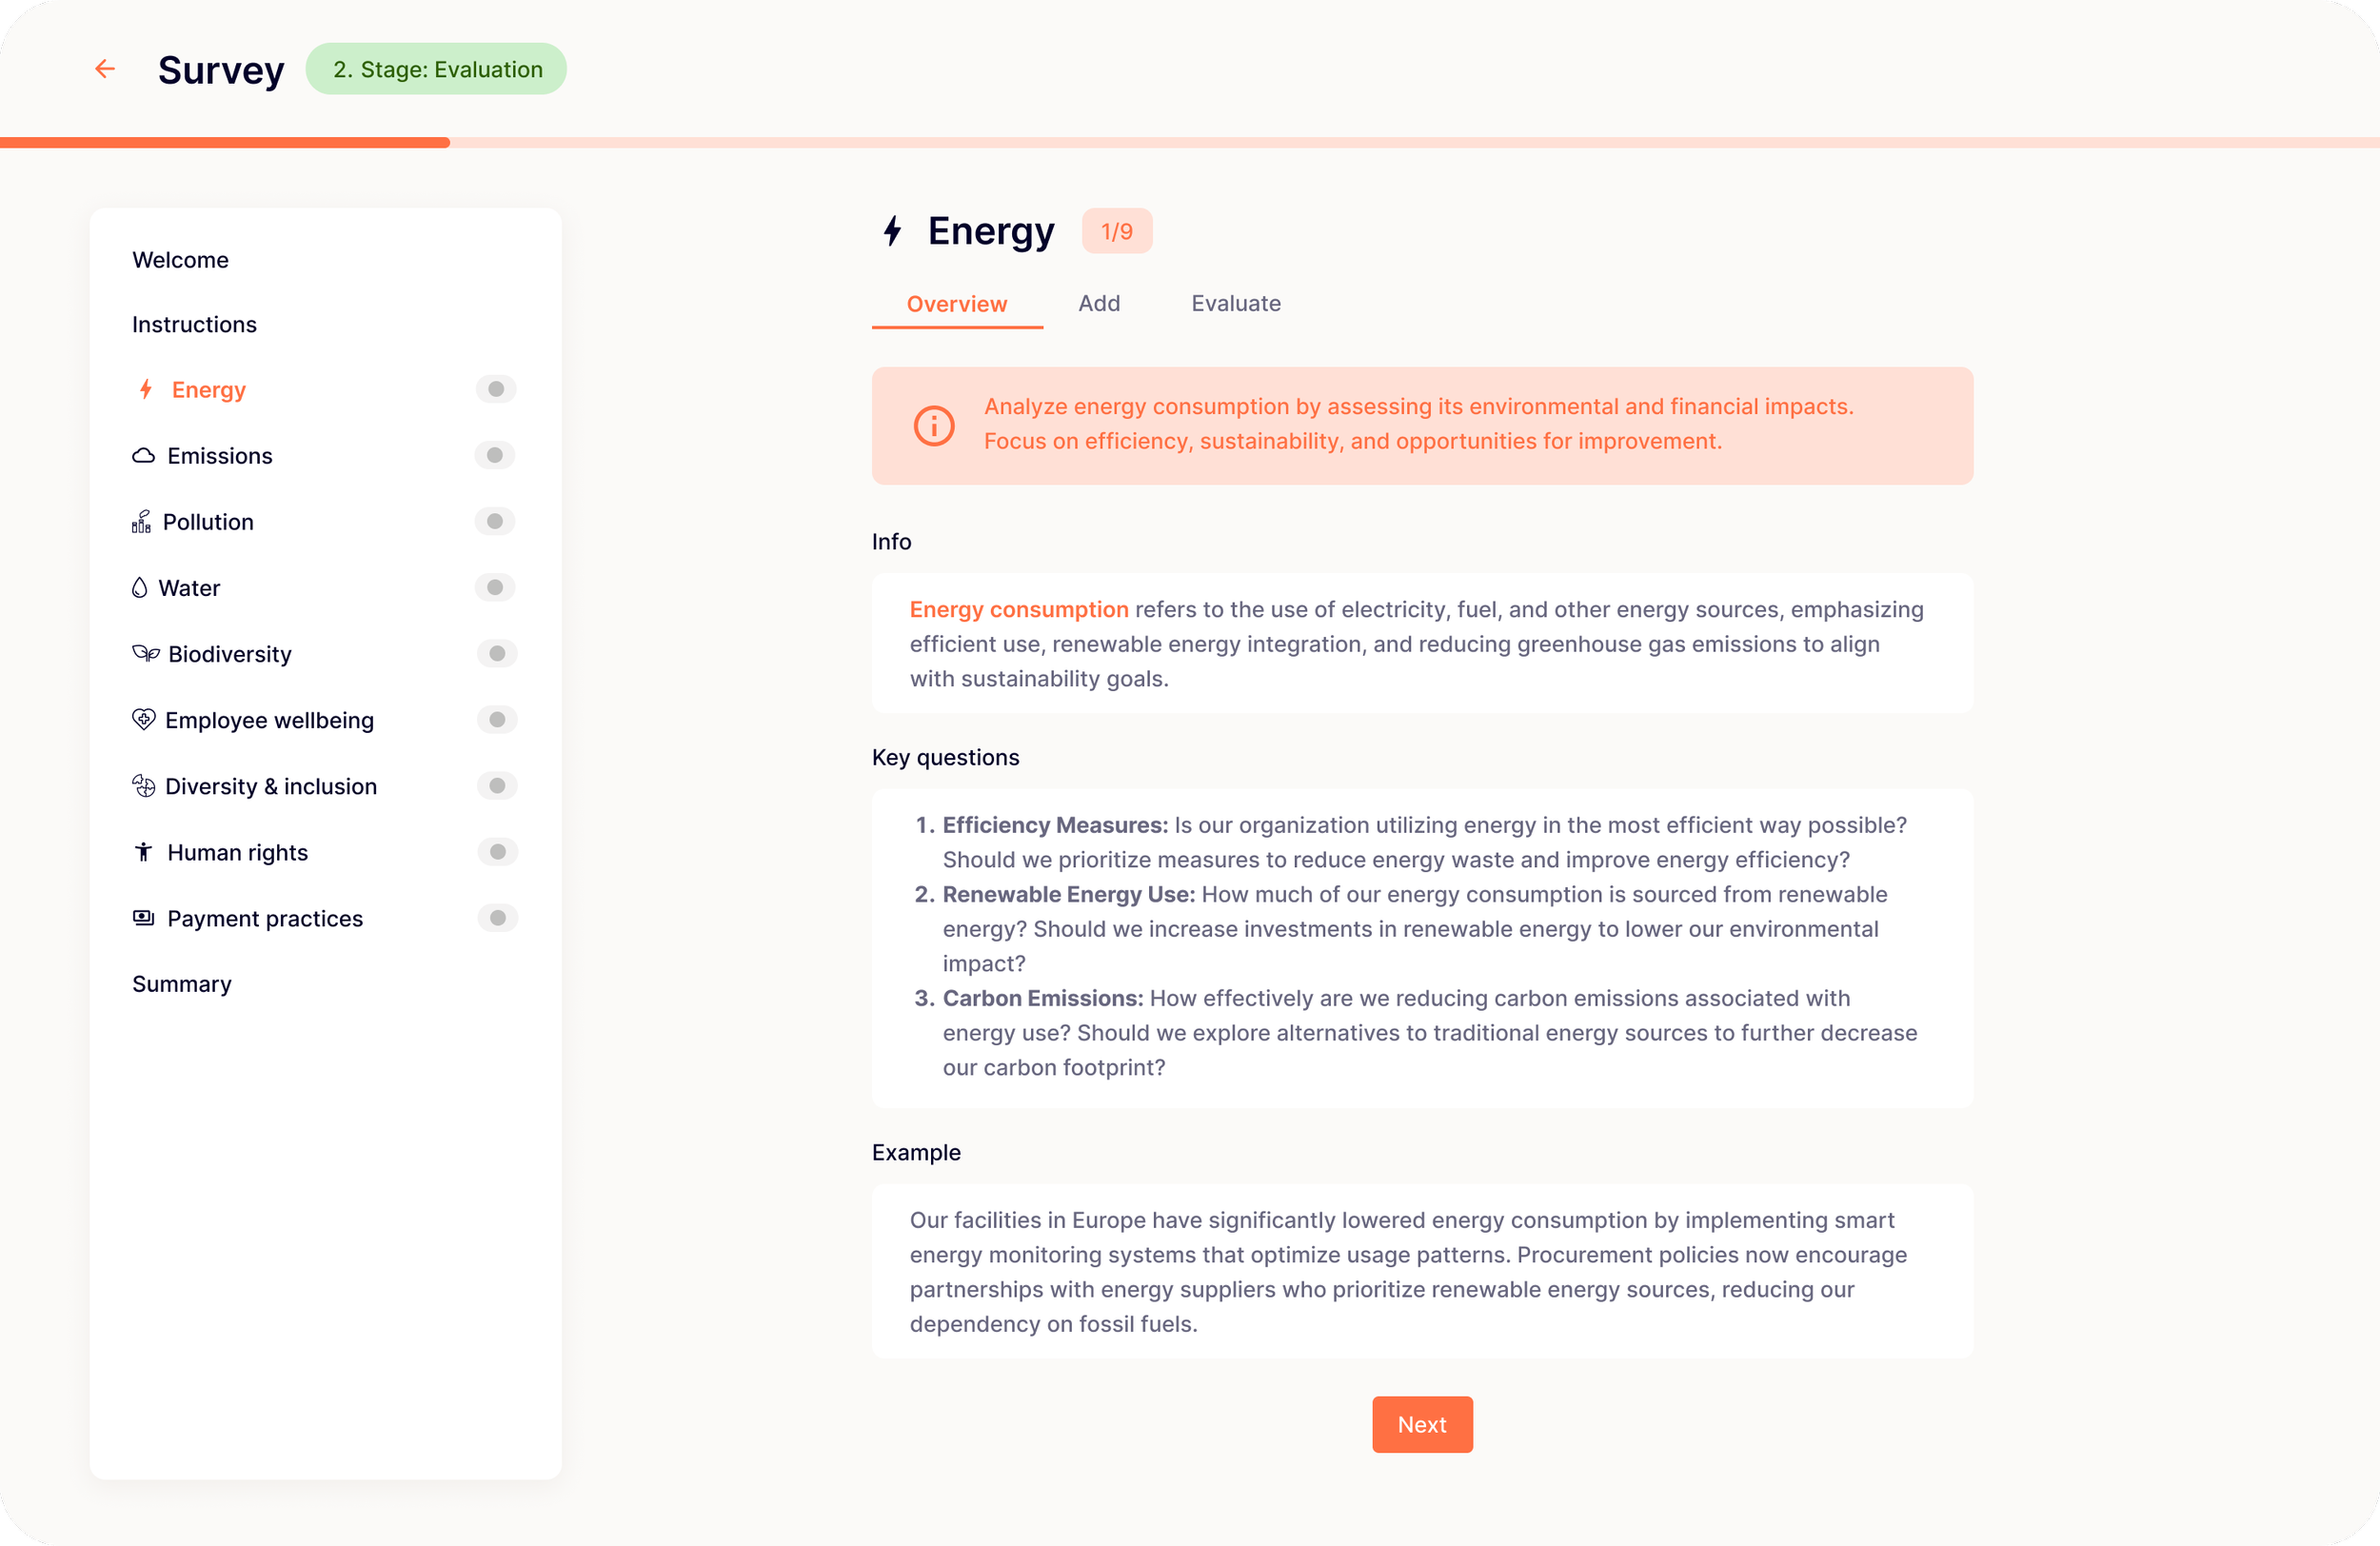
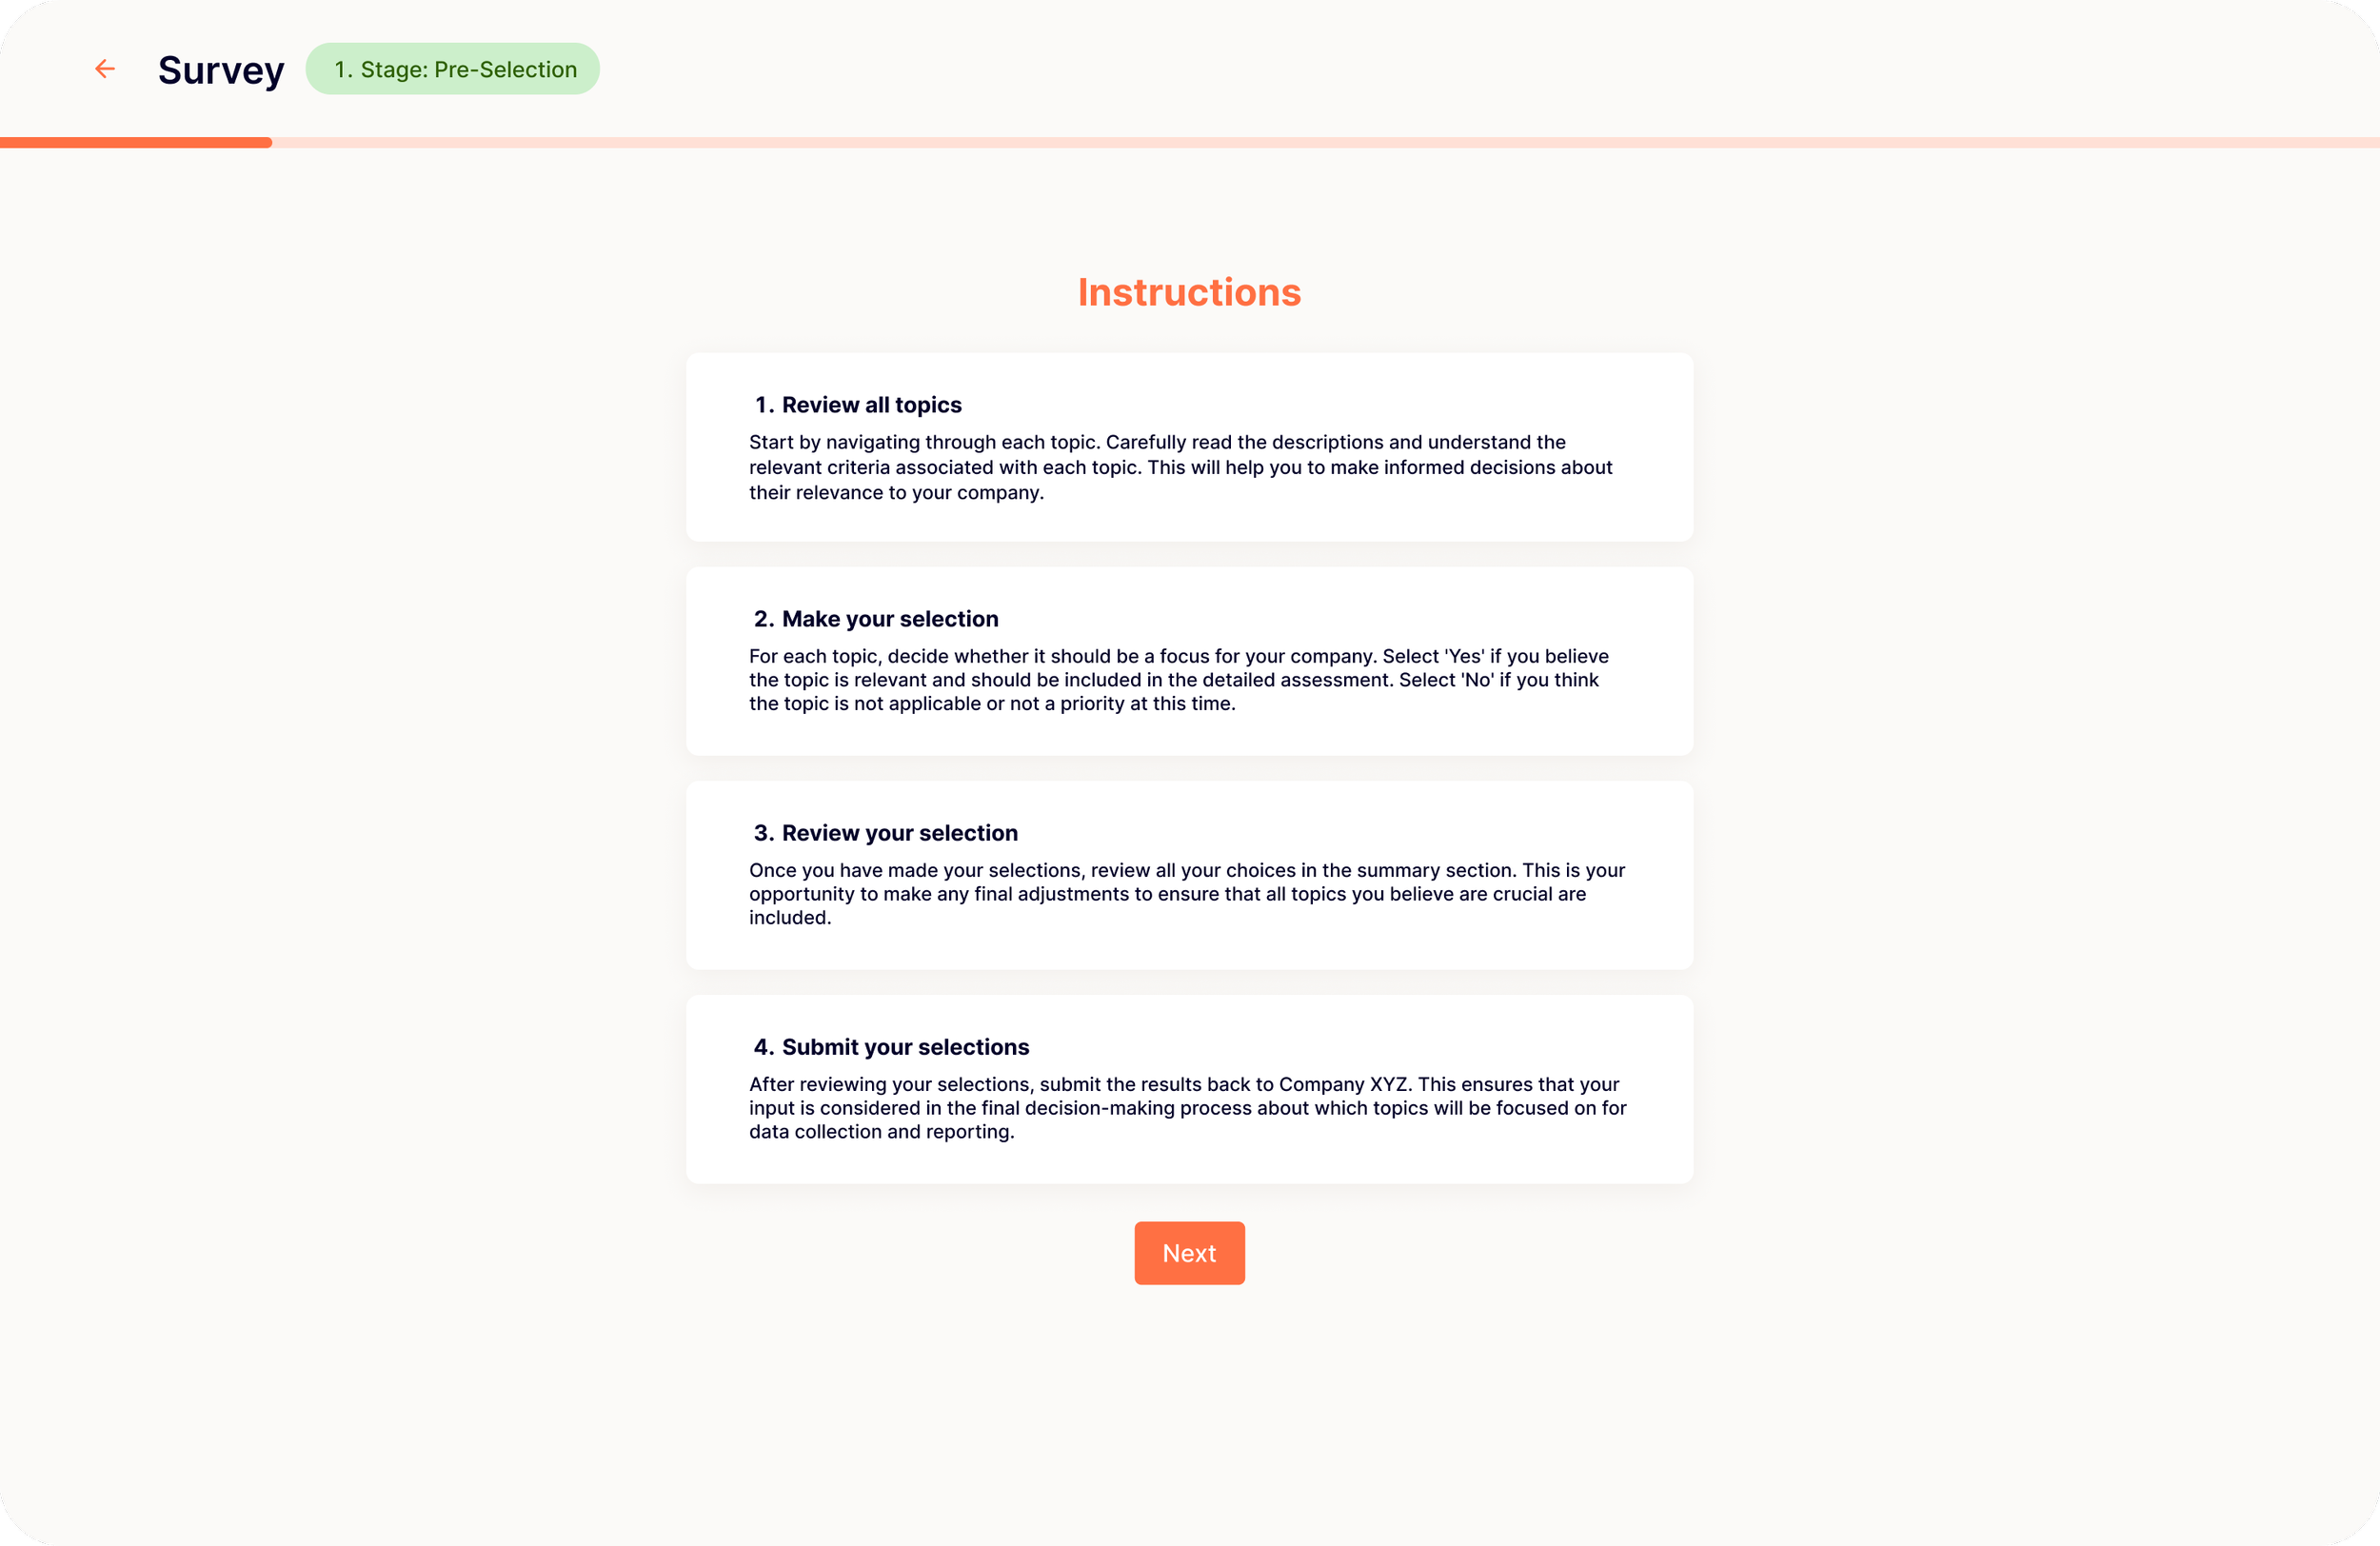
As the contributors don’t have knowledge about sustainability topics, I’ve included a step-by-step instruction page.


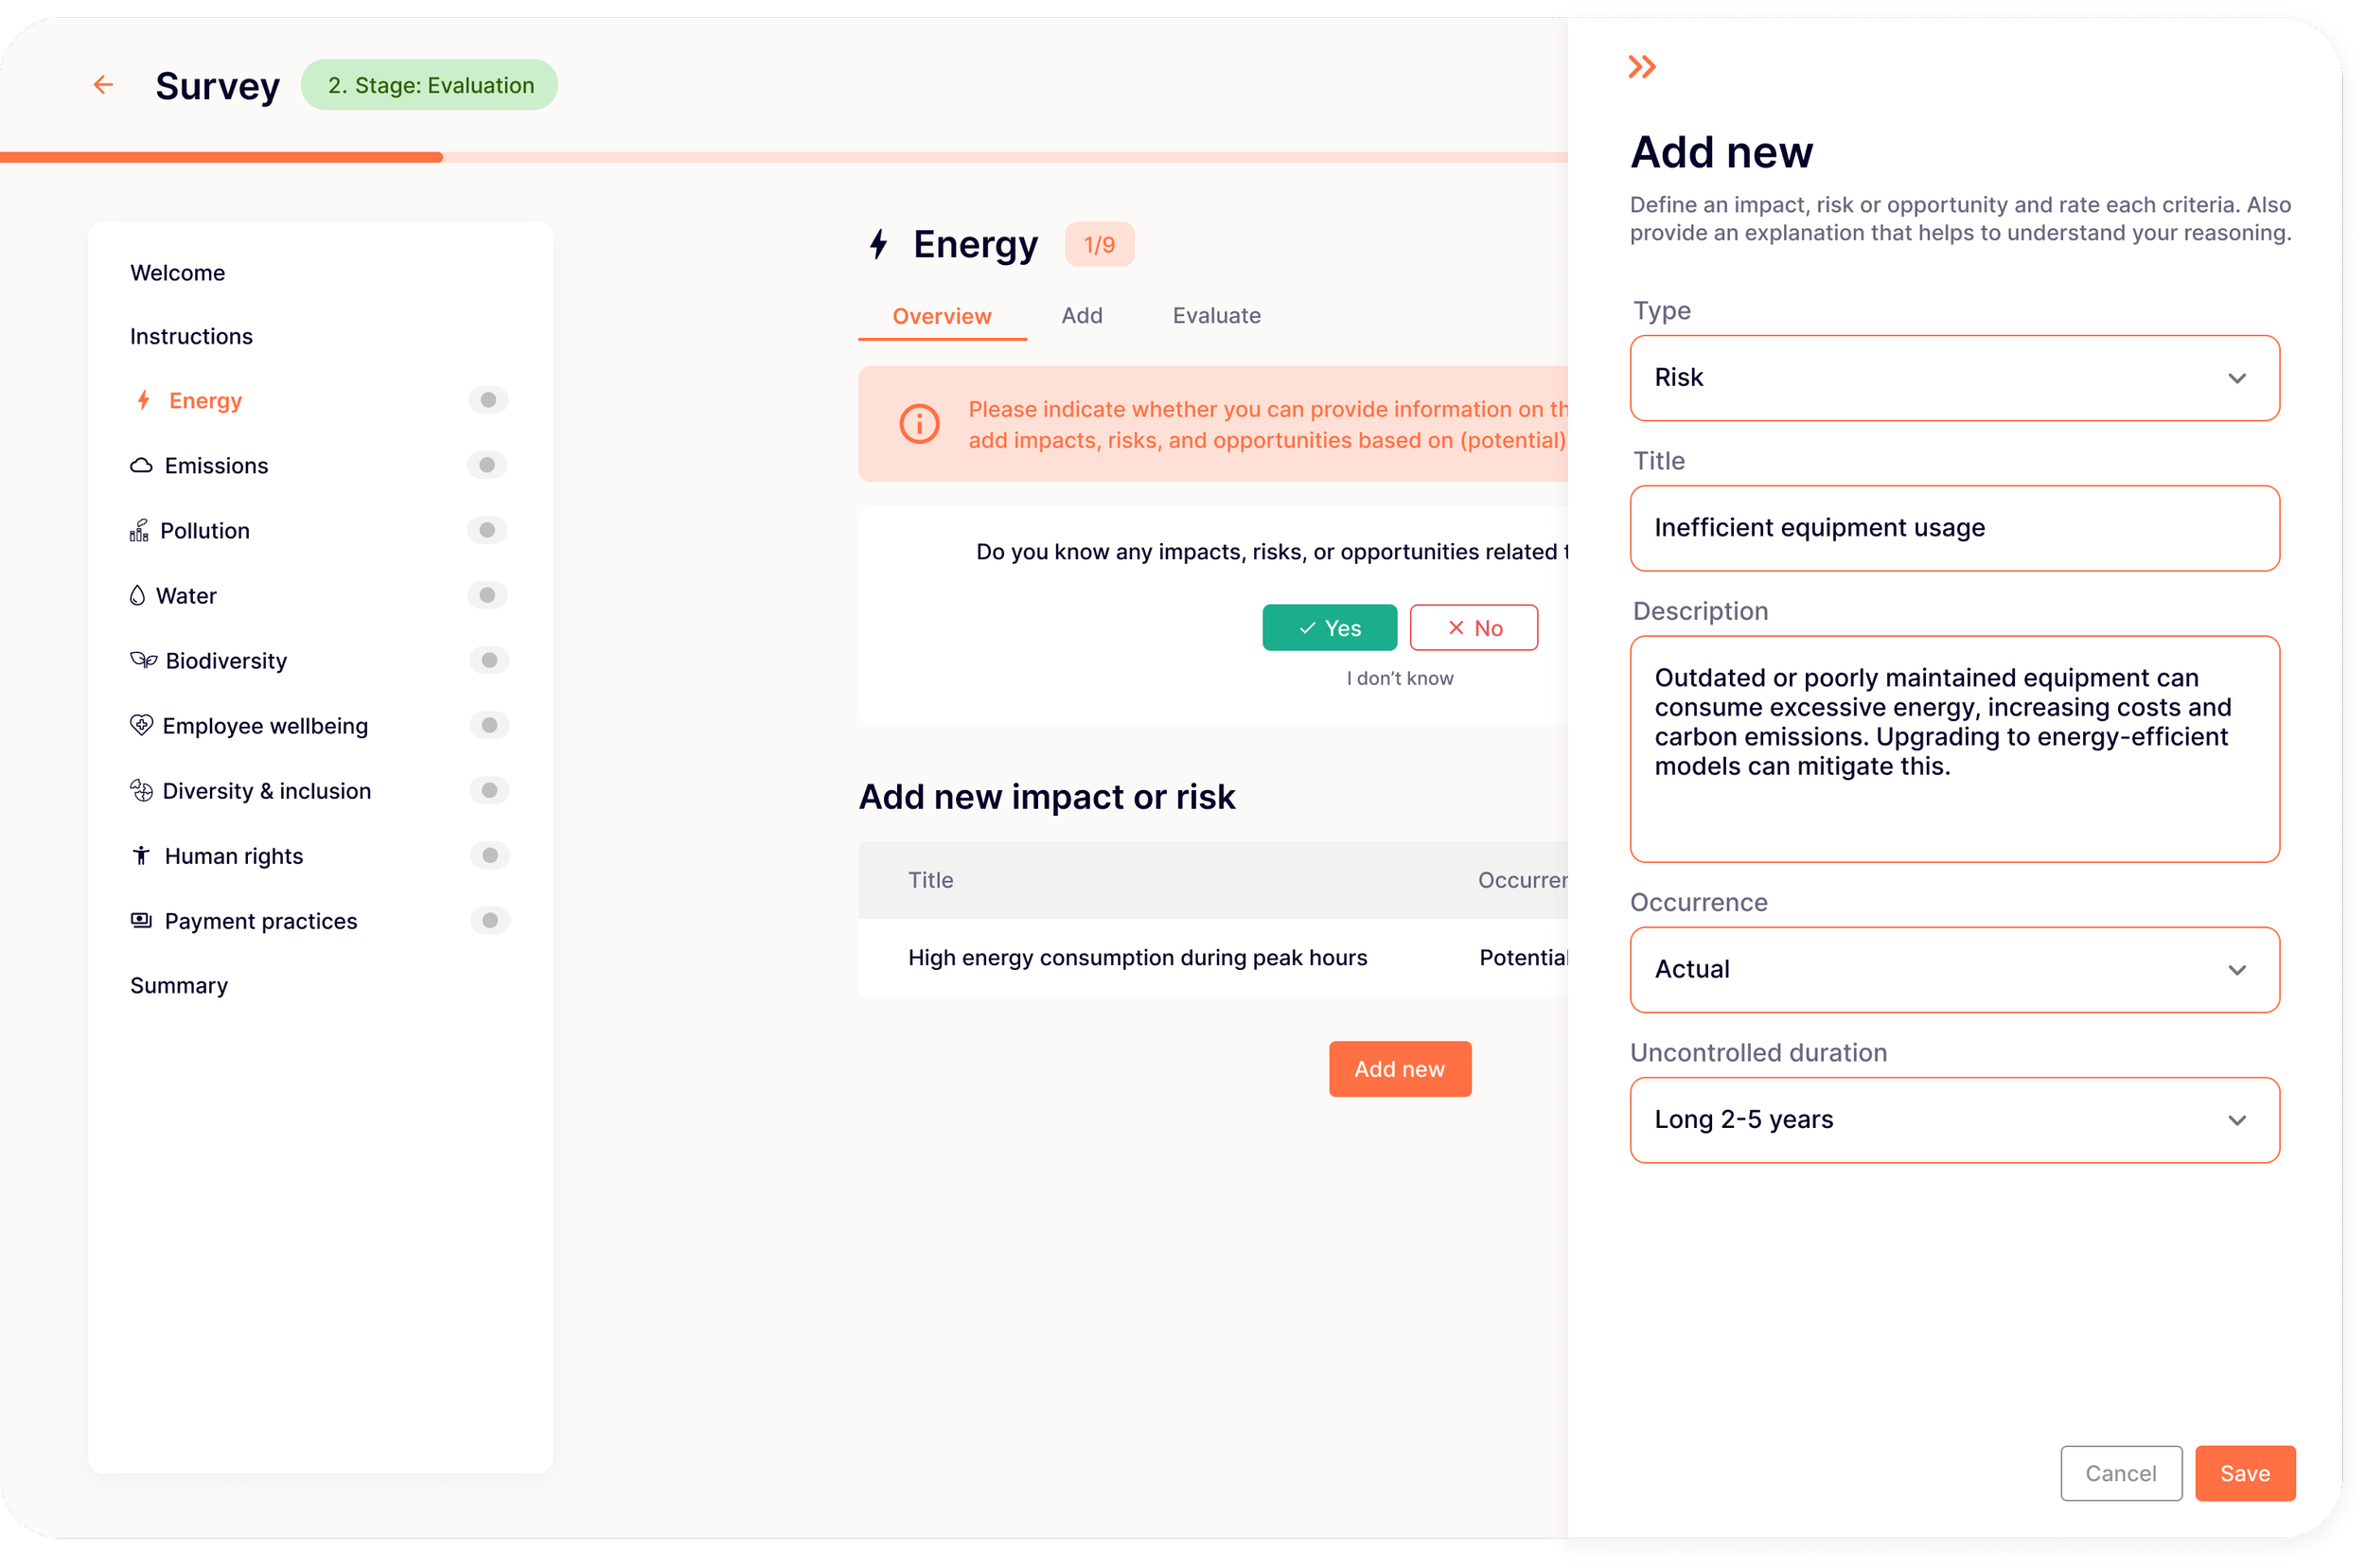
User can add all important information in the side drawer.
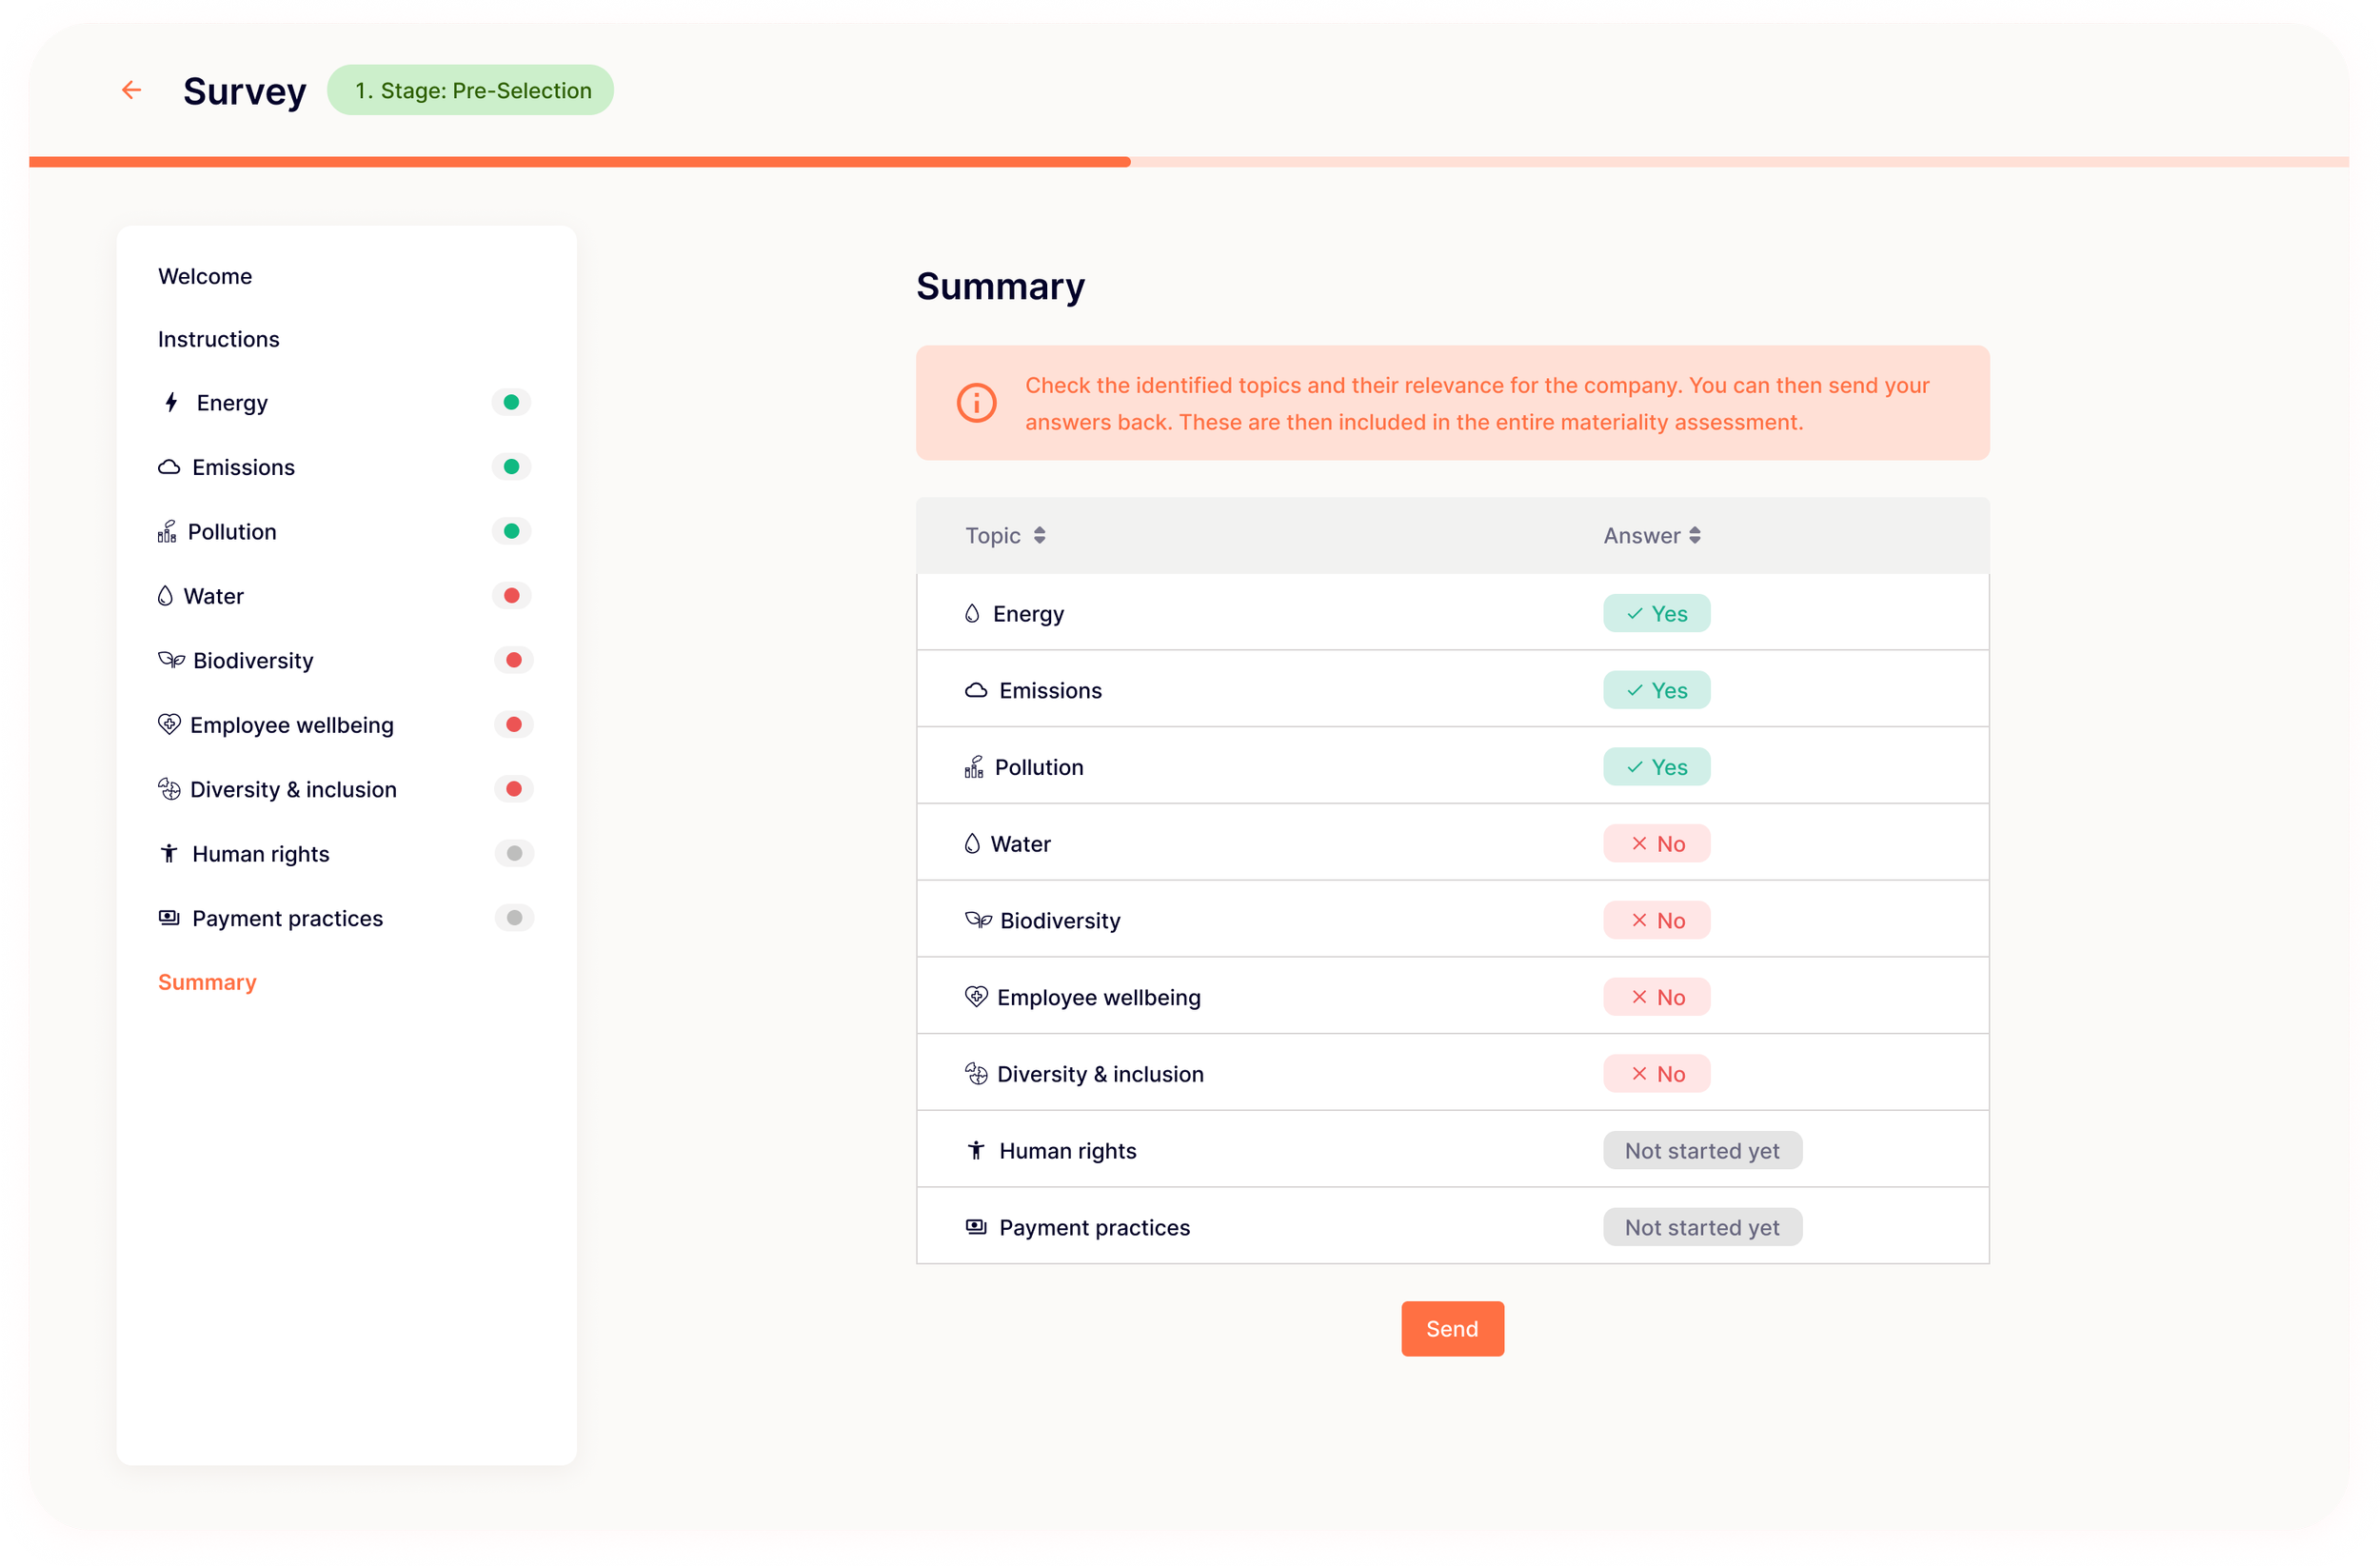
A summary page concludes the answers of the user for a last check.

Implementation
The new tool launched on time, saves a lot of money annually and increases significantly in completion rate
I provided a detailed handoff to developers, including annotated design files and technical documentation. Throughout the implementation phase, I conducted regular design reviews to ensure fidelity and alignment with the prototypes.
Close collaboration with developers during implementation minimized misunderstandings and ensured a smooth launch.

60%
increase in survey completion rates that boost user engagement.
Business Outcome
35%
improvement in data currency that improves reliability of reporting.
50%
higher user satisfaction through guidance and education.
Final Design
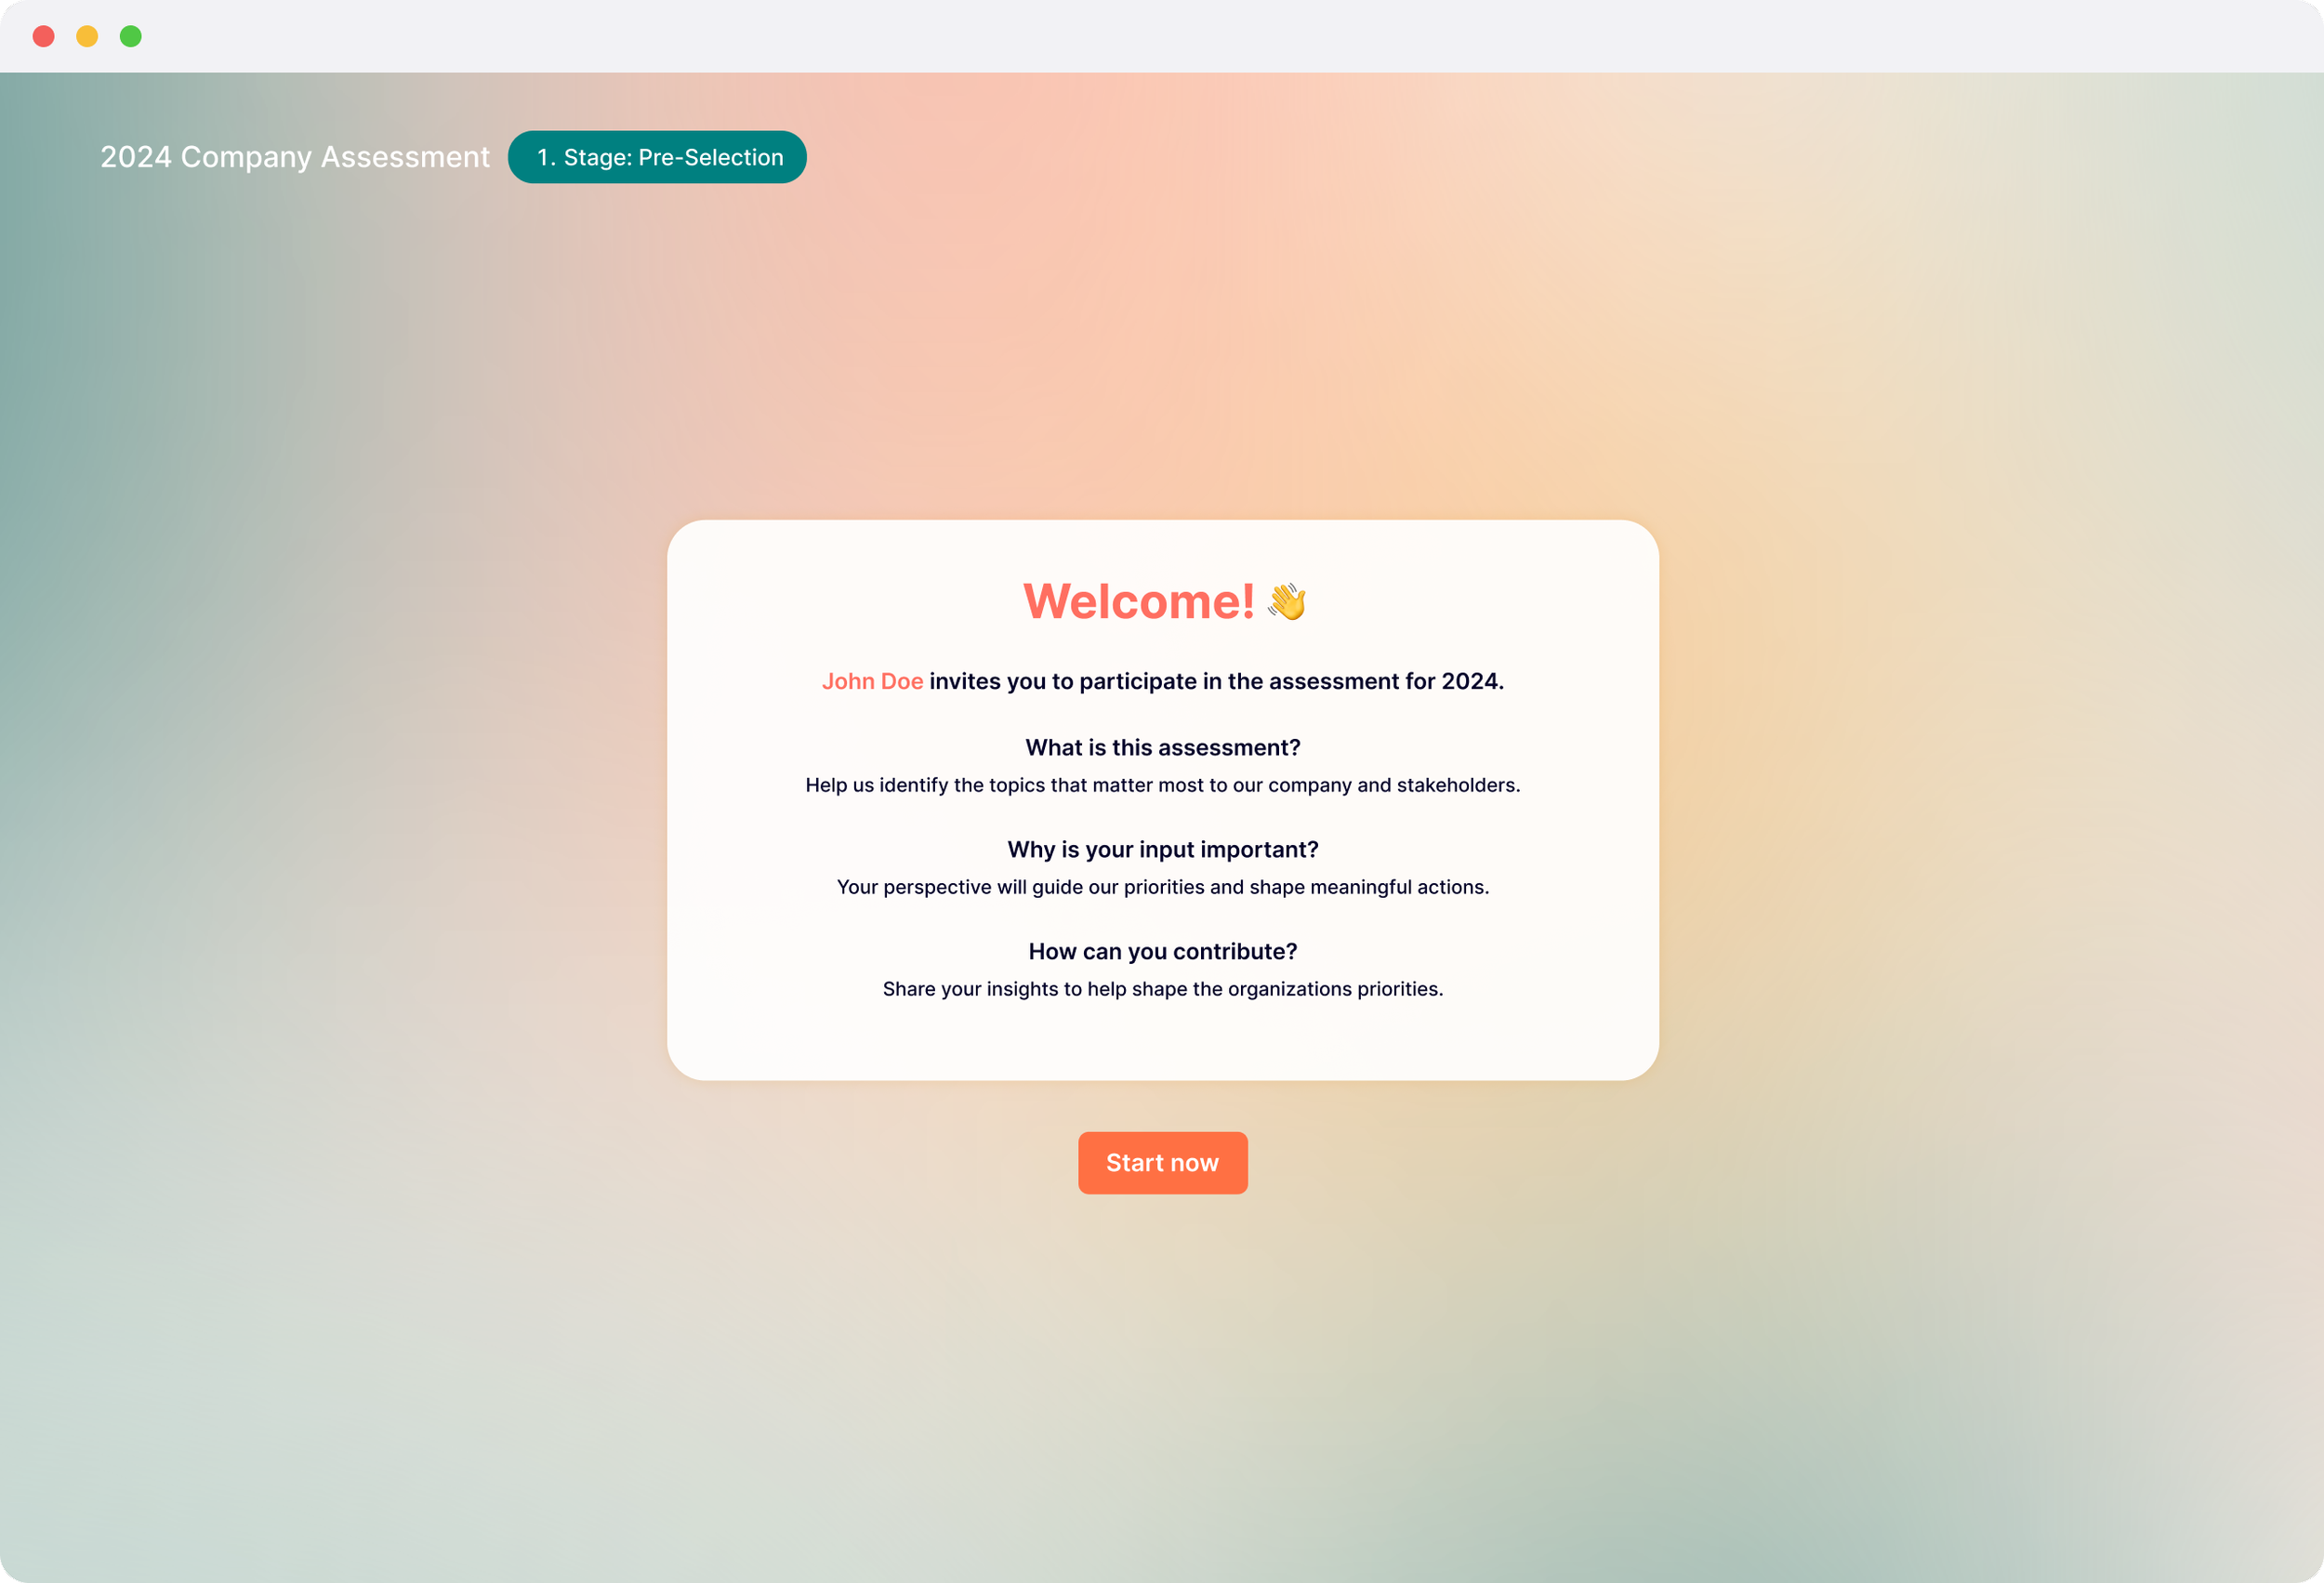
Survey 1
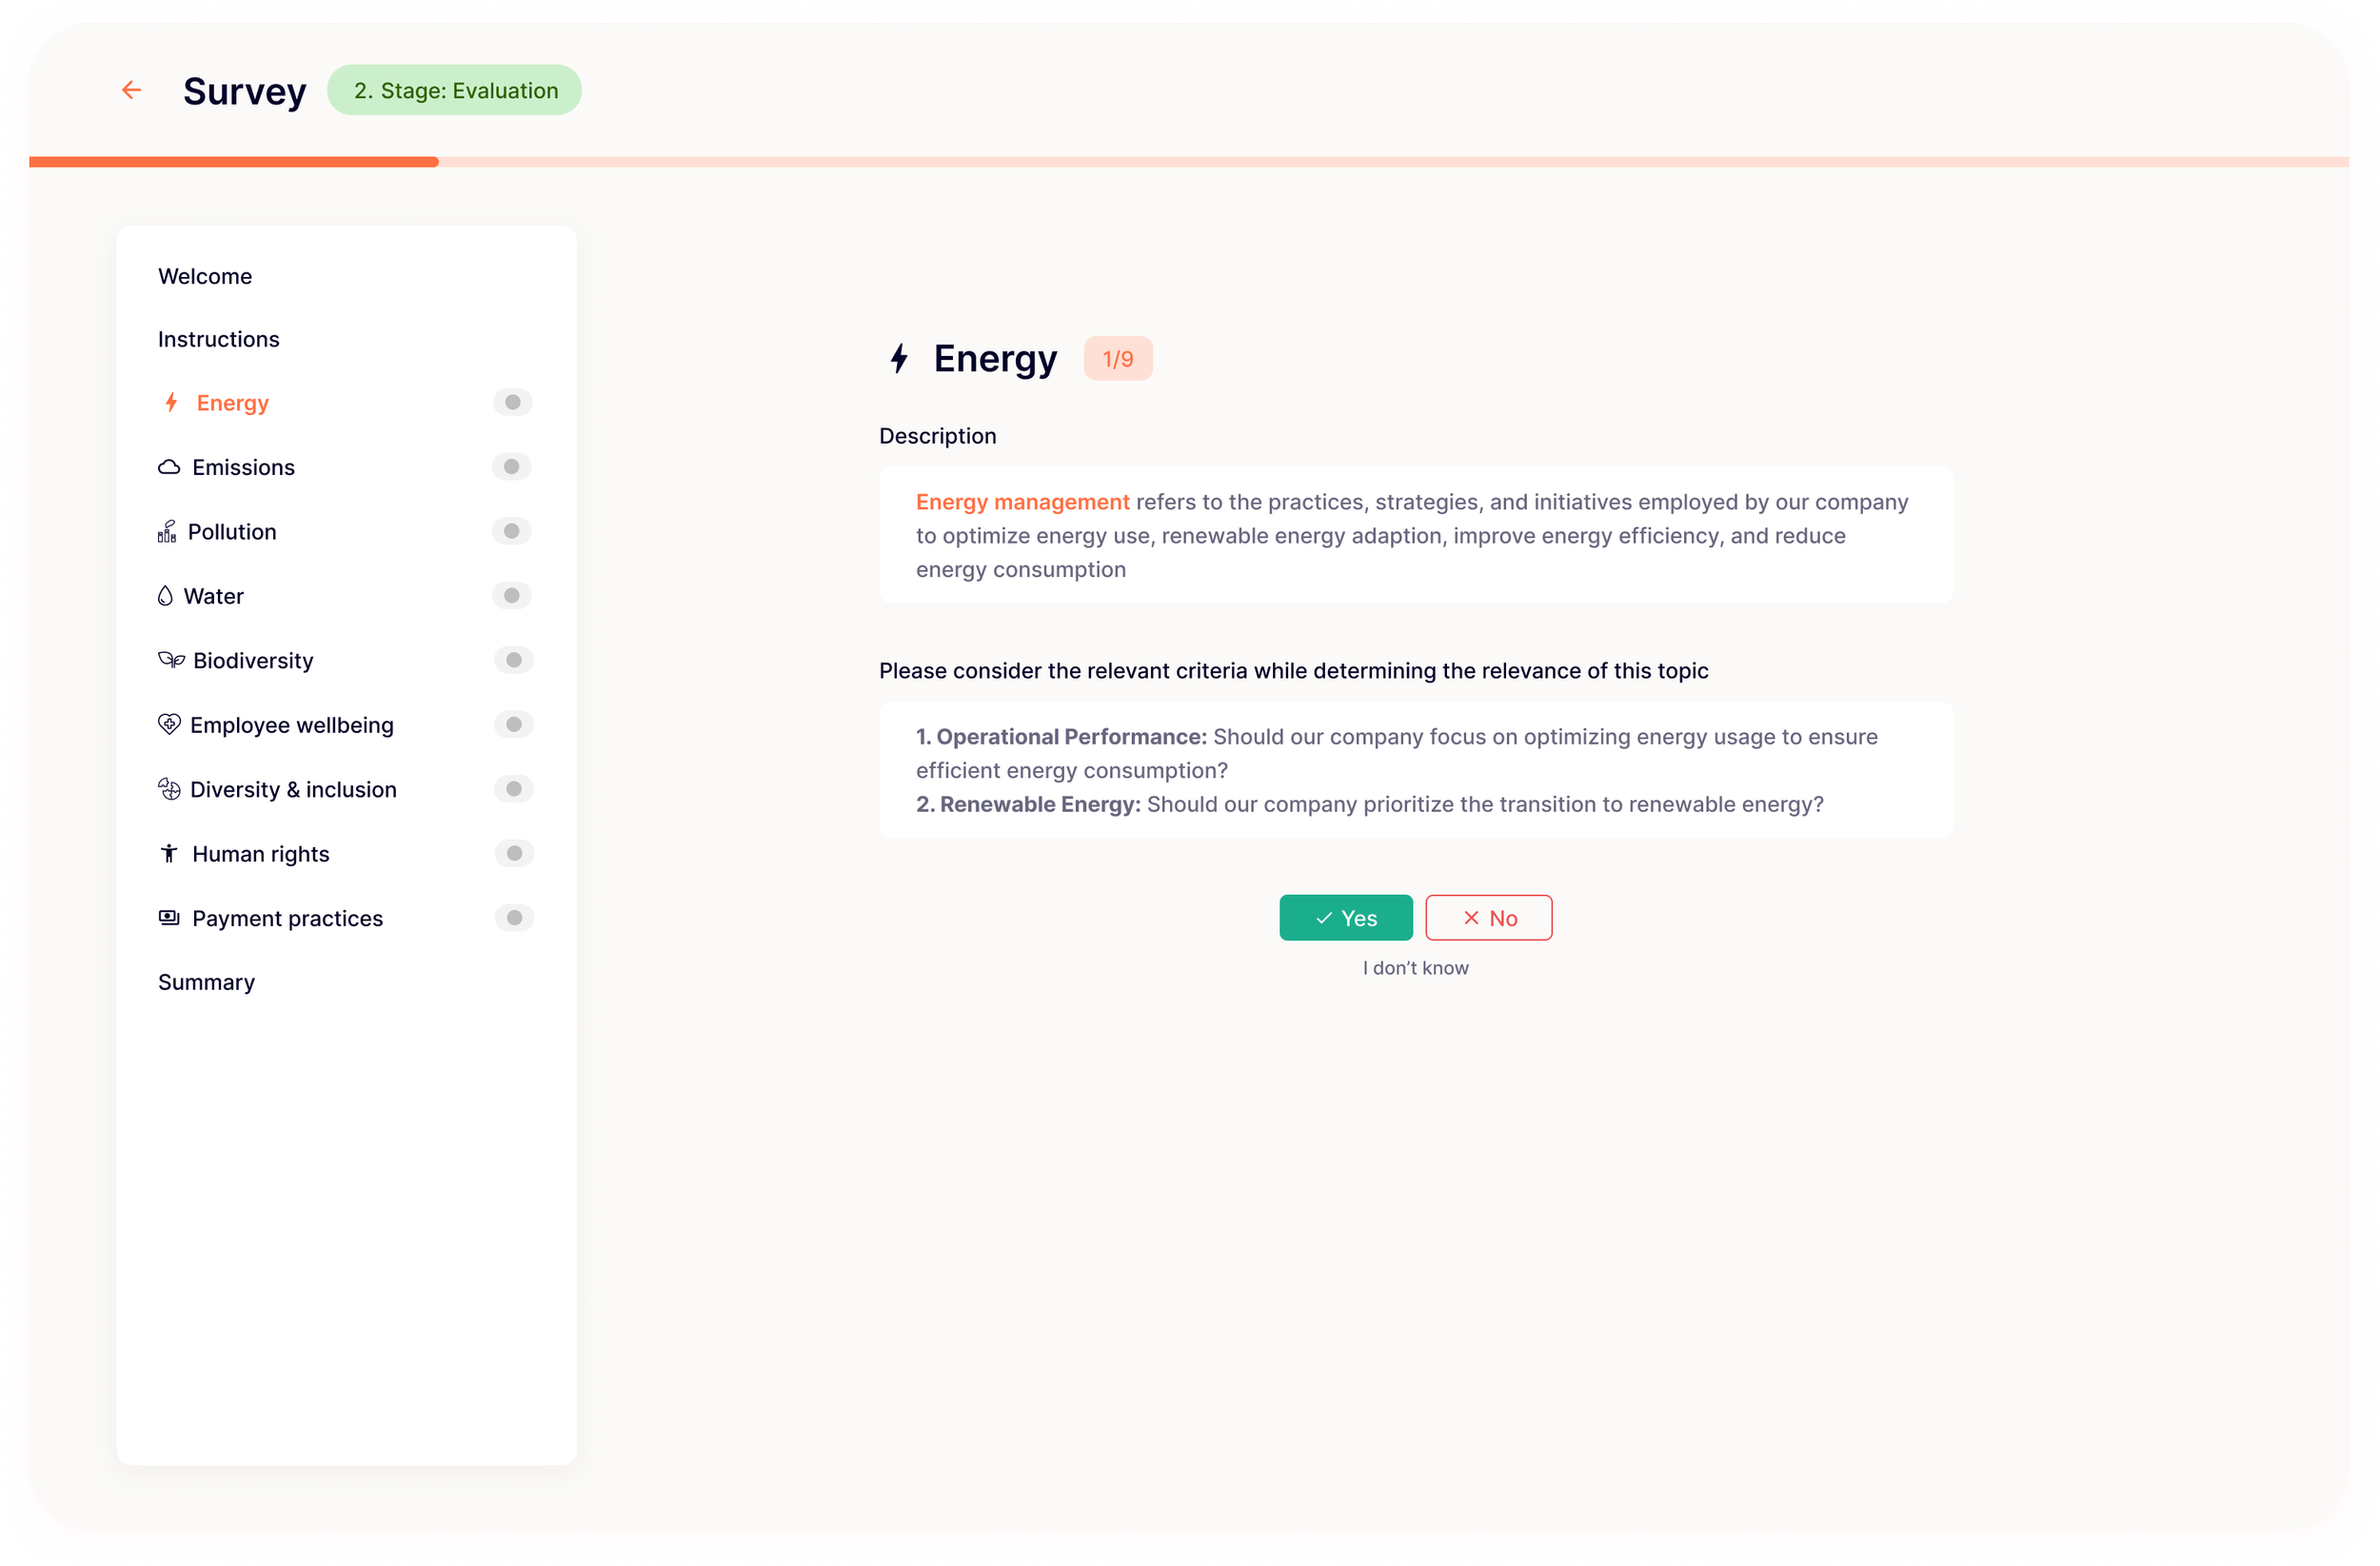
Contributors (Financial experts or HR) are pre-selecting which topics are relevant or not.

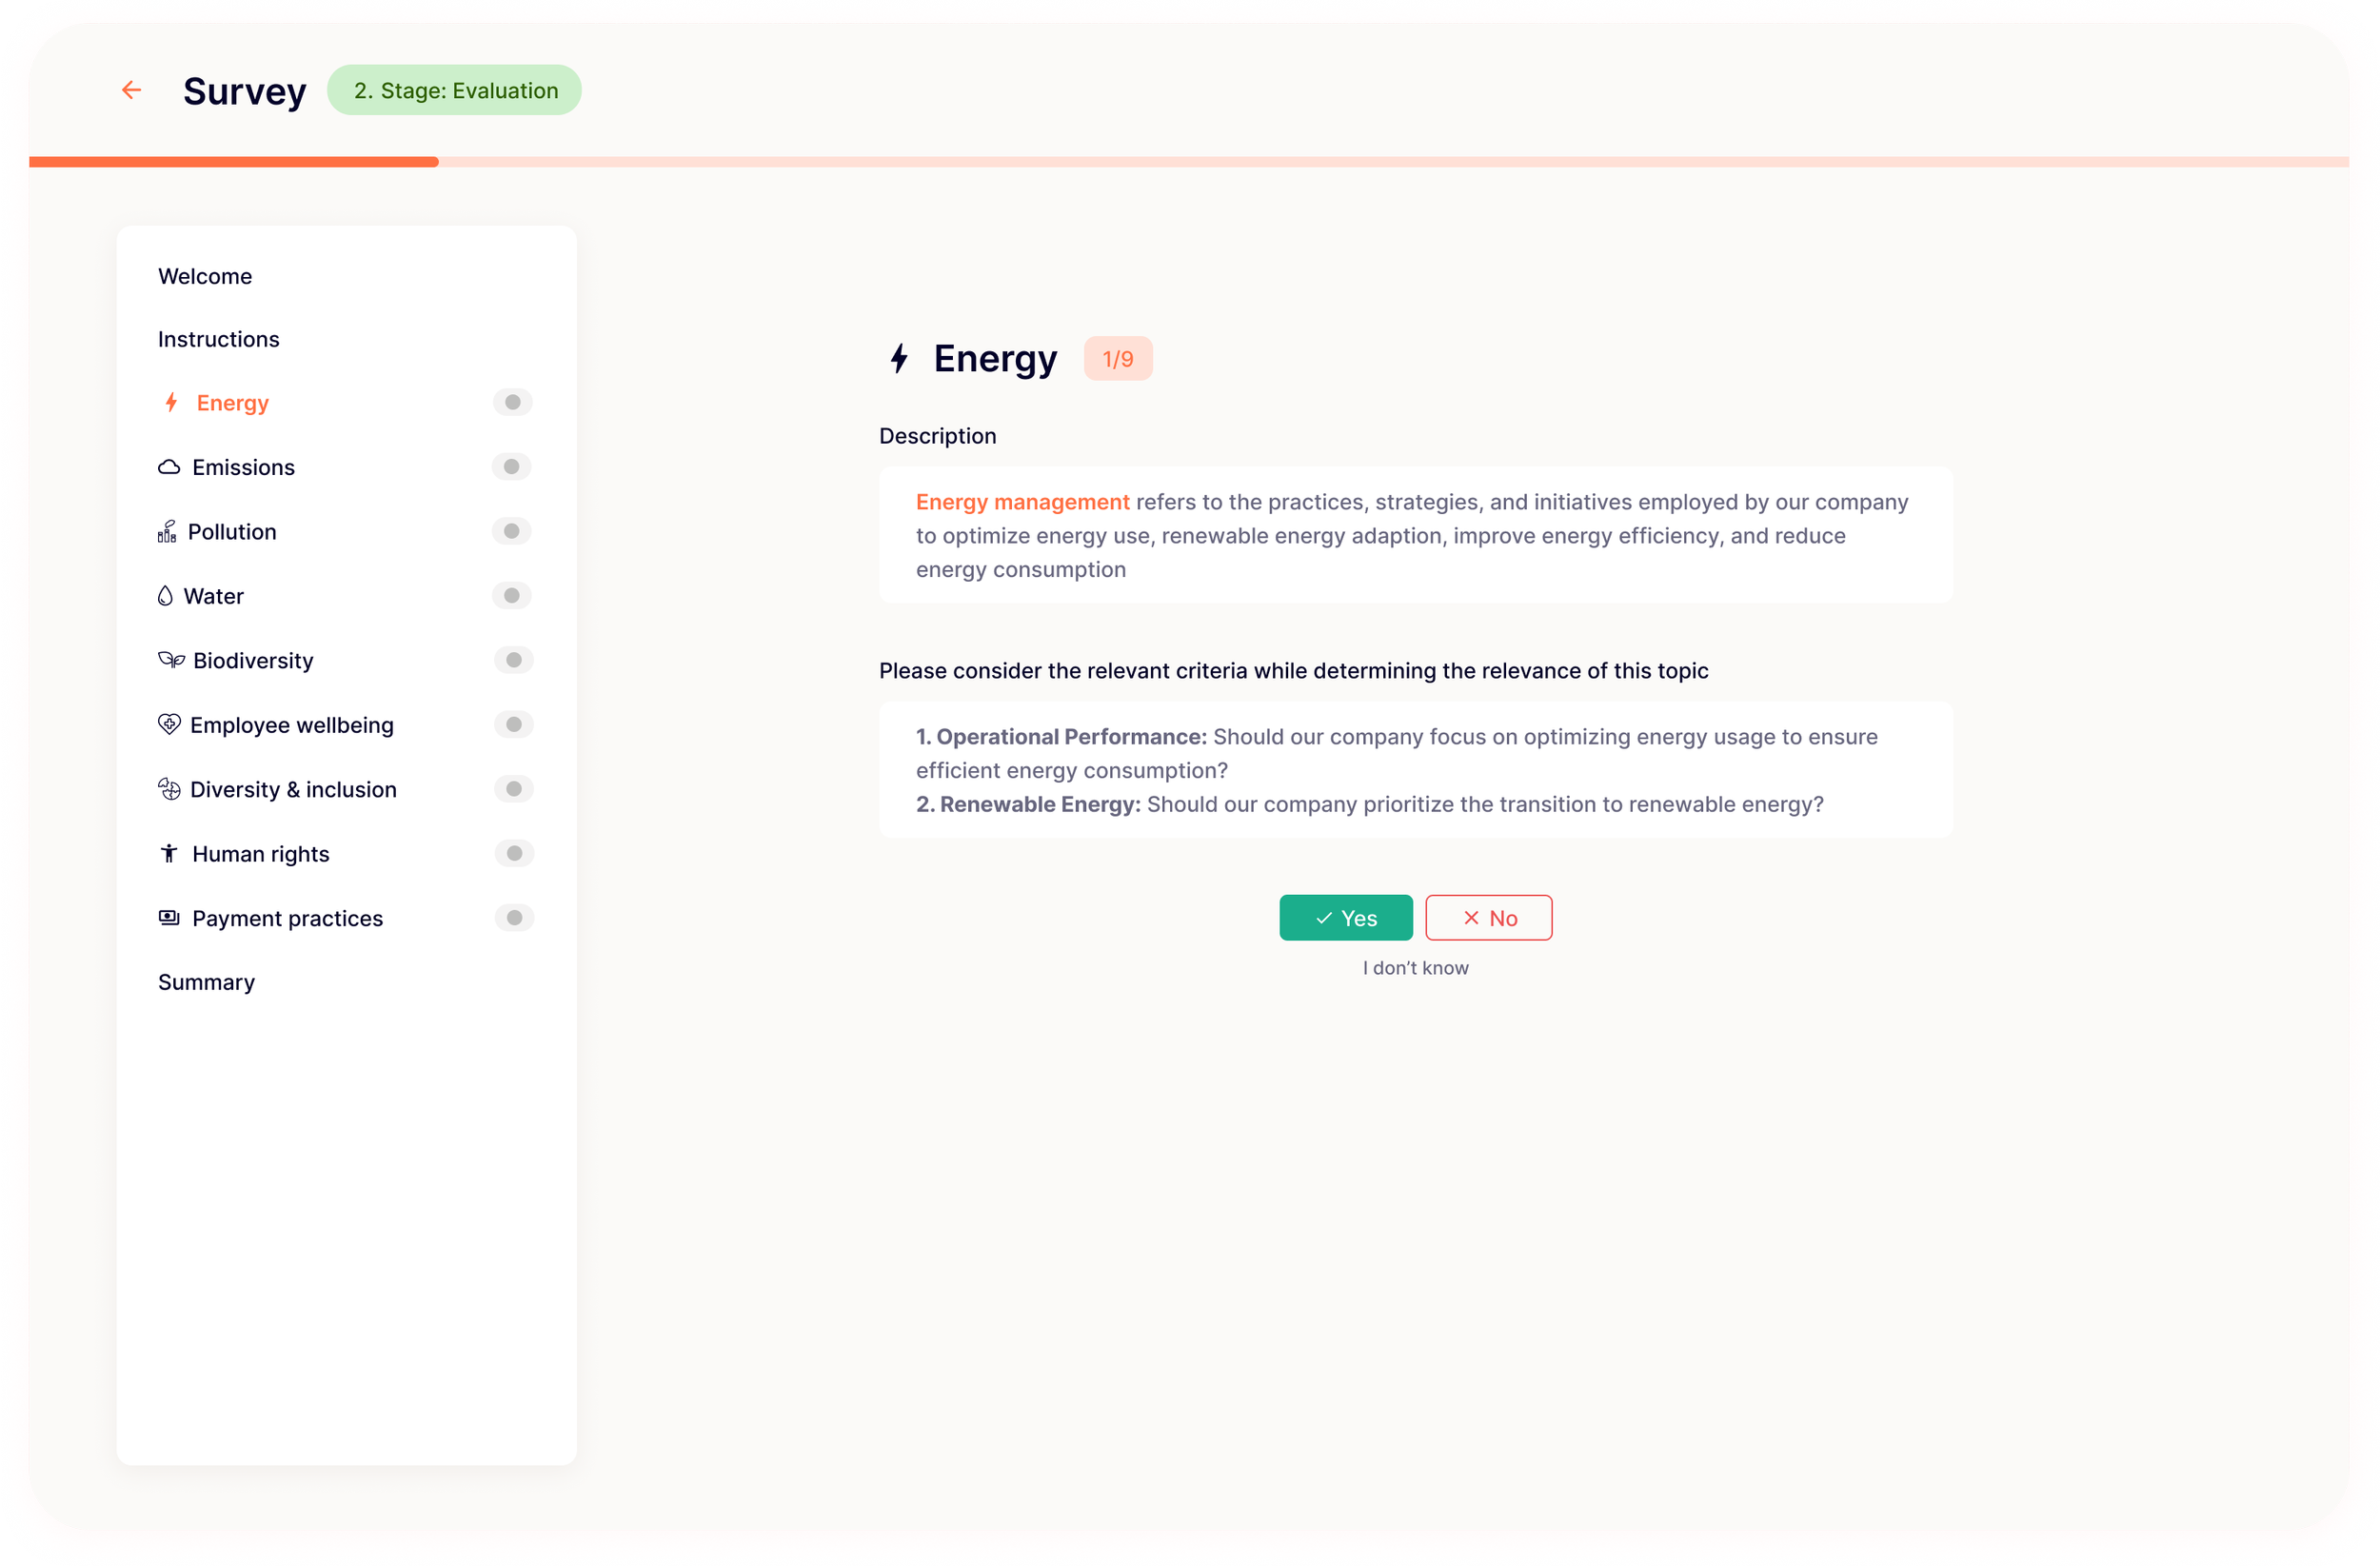
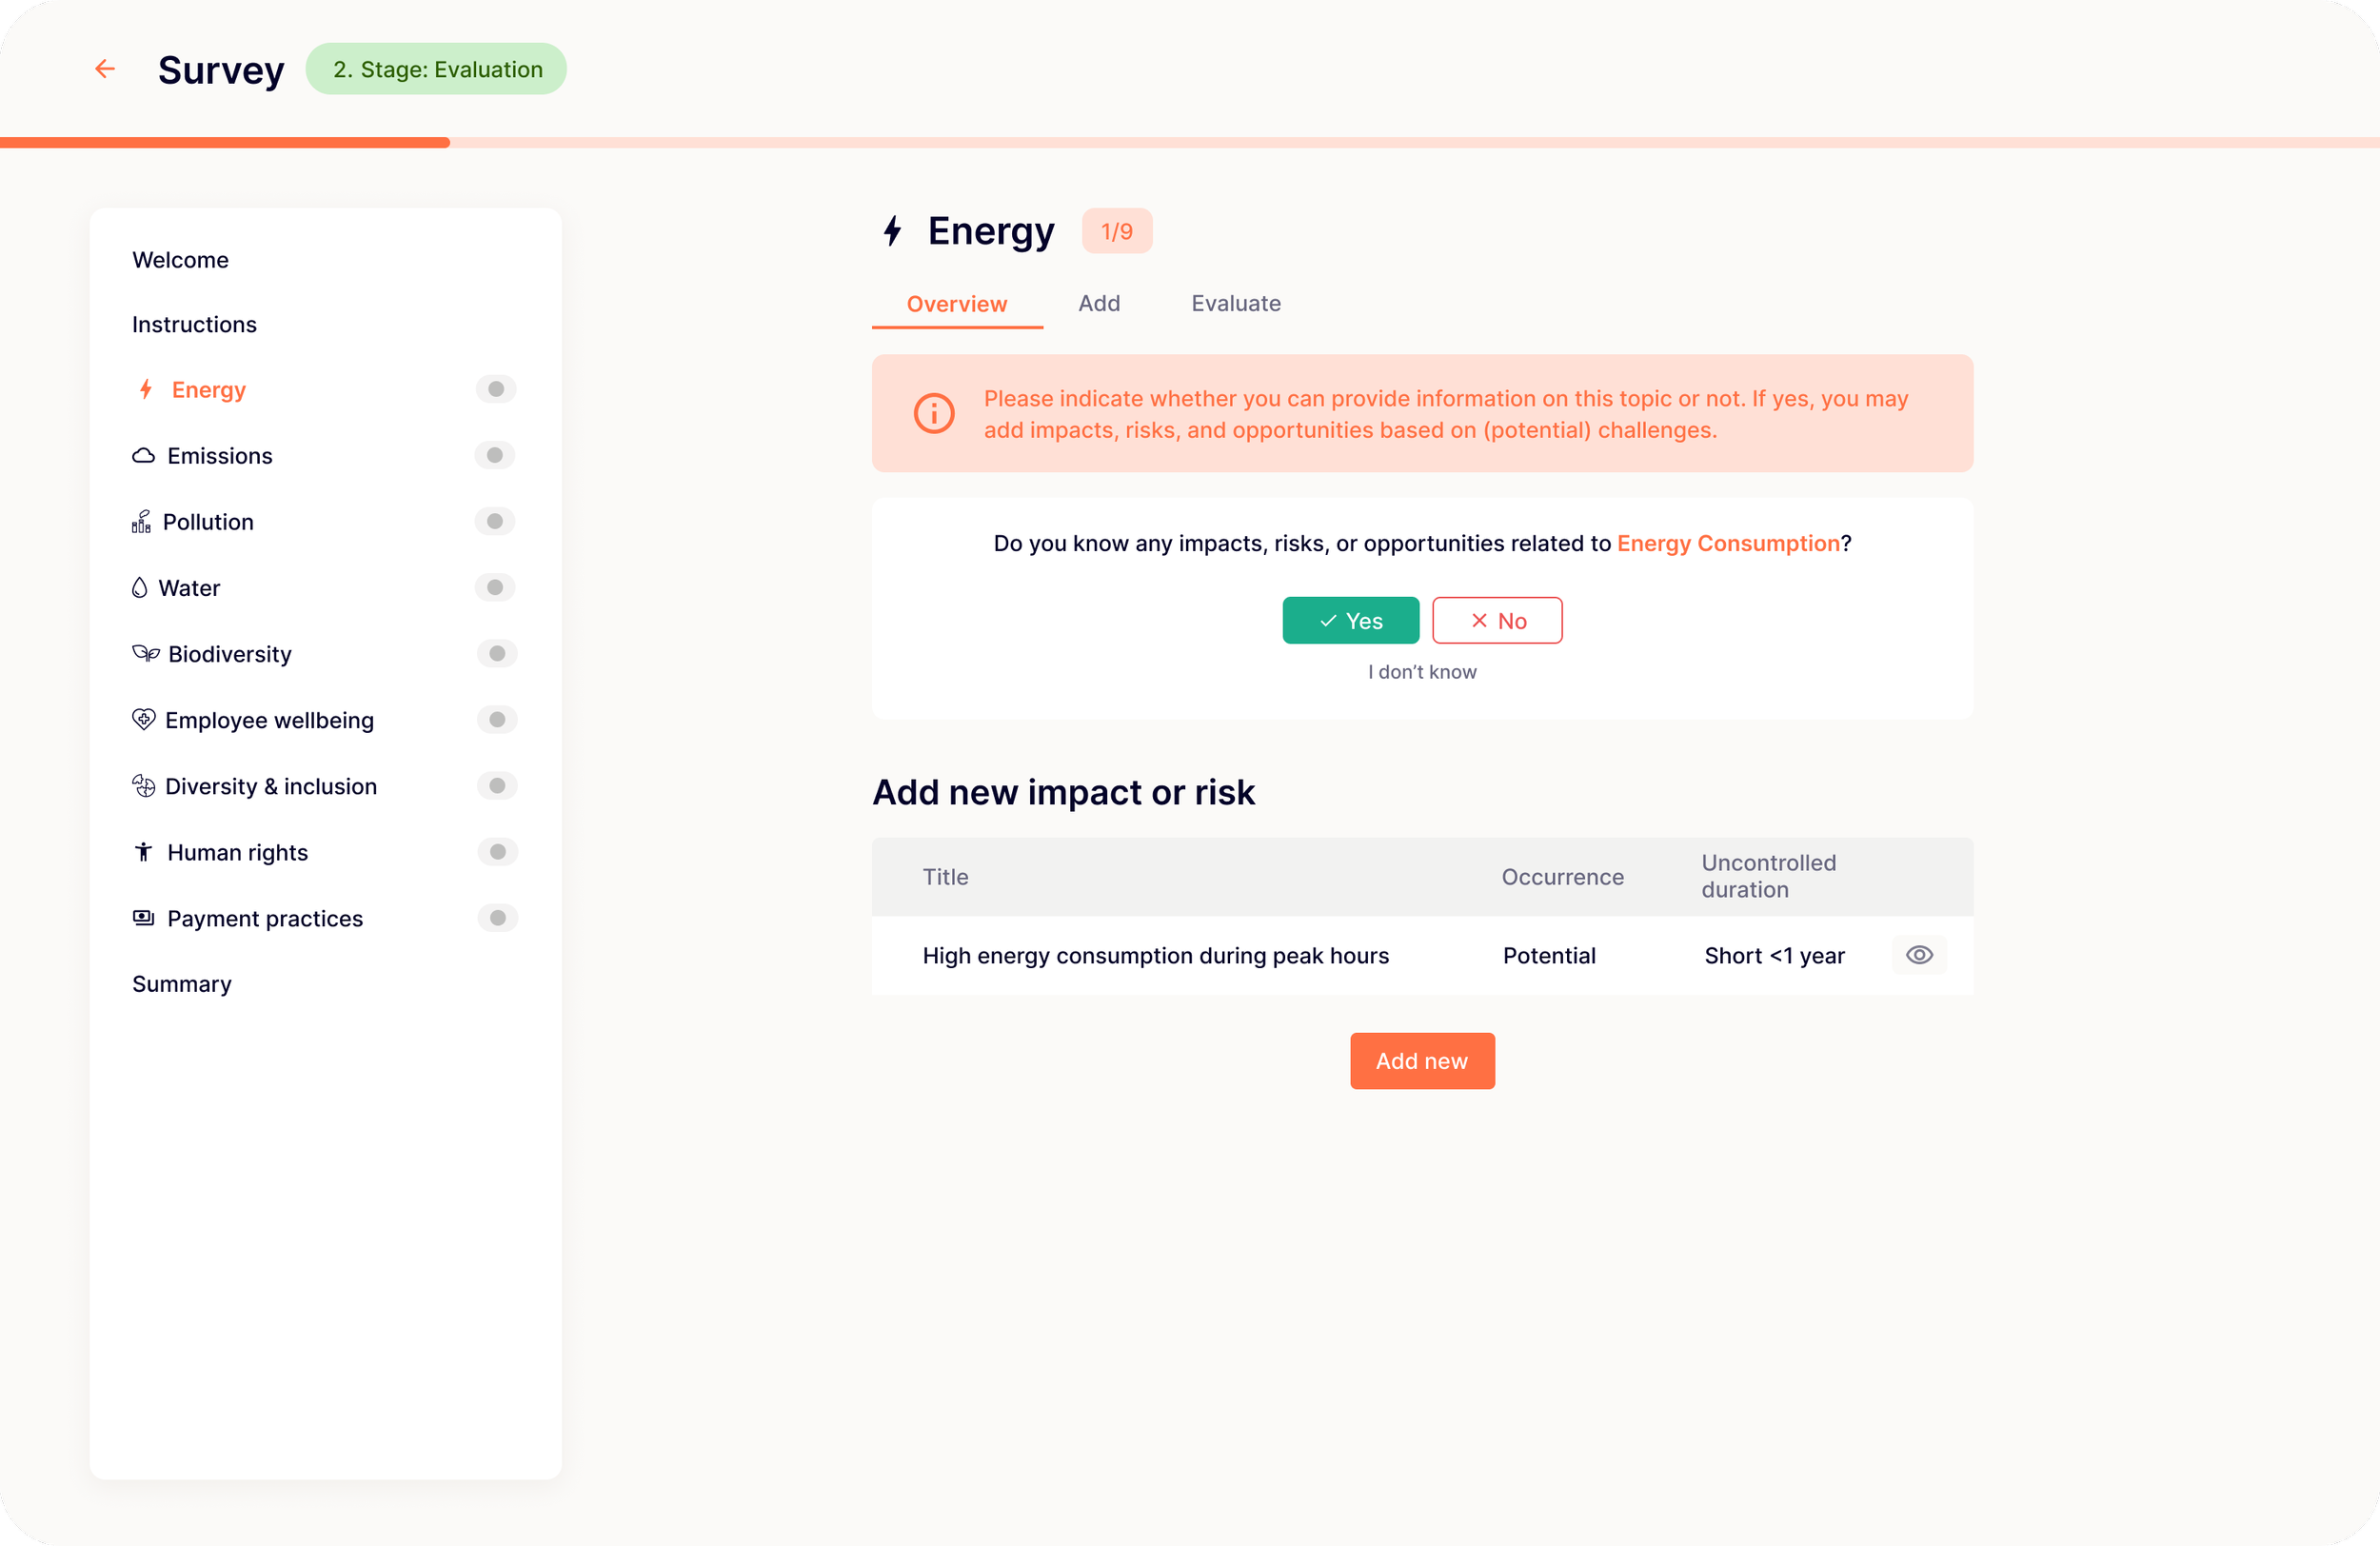
Survey 2
Contributors define risks and impacts of each sustainability topic. Every item needs an evaluation based on four criteria.